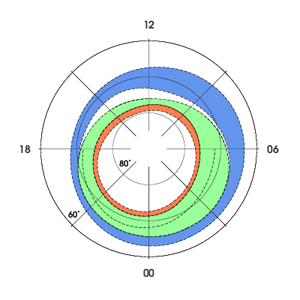
The model presented here shows the planetary distribution (corrected geomagnetic latitude - local geomagnetic time) of different type auroral precipitation (location, average energy and energy flux) depending on a level of the geomagnetic activity determined by AL and Dst indexes.
This model is based on the statistical treatment of the DMSP F6 and F7 spacecraft observations made for 1986 (http://sd-www.jhuapl.edu/). It was the year of a minimum of solar activity, but during 1986 significant magnetospheric disturbances including the magnetic storm on February 8-10 with the intensity in the Dst index of about -300 nT, were observed.
The special database containing more than 30000 spacecraft passes in the northern and southern hemispheres has been created to construct a planetary distribution of auroral precipitation. For each of the spacecraft passes, besides the standard data on position of auroral precipitation boundaries and characteristics of precipitating particles [Newell et al., 1991], our database contains the information on the solar wind plasma and interplanetary magnetic field as well as the values of magnetic activity indexes and a phase of a magnetospheric substorm when the measurements were carried out. All phases of a substorm were divided into three subphases corresponding to their initial, middle and final stages. For the AL index its 1-hour and 5-min averaged values were included in the database.
To increase the statistical significance of the results all spacecraft passes were divided into eight 3-hour intervals of local geomagnetic time (00-03 MLT, 03-06 MLT, 06-09 MLT, etc.). Root-mean-square deviation of boundary’s position from average values is about 2°-3° of latitude depending on MLT, magnetic activity level and type of boundary.
A new notation was used to designate auroral regions with different characteristics of precipitating particles.
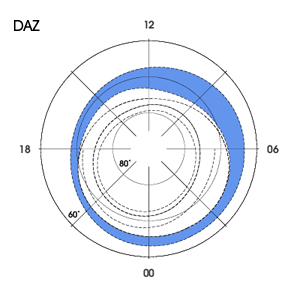
DAZ (diffuse auroral zone) is the region of diffuse precipitation located equatorward from an auroral oval and spatially coincided with a zone of diffuse aurorae.
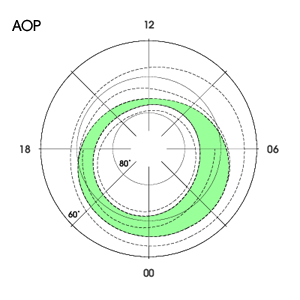
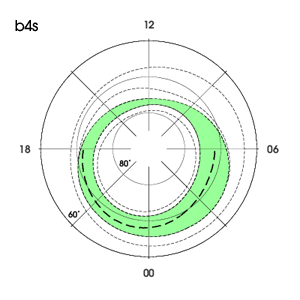
AOP (auroral oval precipitation) is the region of structured precipitation whose equatorward boundary spatially coincides with equatorial border of an oval of discrete auroral forms. At nighttime the AOP region is divided into two zones by b4s boundary witch is the onset of special structure in electron precipitation on a scale ≥ 5-10 km [Newell et al., 1996]
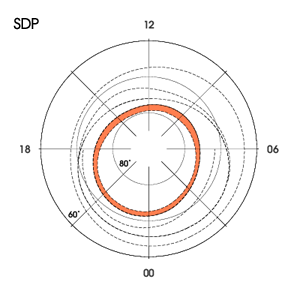
SDP (soft diffuse precipitation) is the region of soft diffuse precipitation poleward of the АОР region.
The similar structure for the nightside auroral luminosity has been offered earlier in the paper by [Galperin and Feldstein, 1991; Feldstein and Galperin, 1993].
In the new notation the equatorward boundary of the DAZ region is the b1e boundary on the nightside [Newell et al., 1996] and the equatorward boundary of the CPS type precipitation on the dayside [Newell et al., 1991b]. Poleward boundary of this region is the b2e boundary on the nightside and a poleward boundary of the CPS precipitation on the dayside.
Equatorward boundary of the AOP region is the b2e boundary and the equatorward boundary of the BPS type precipitation on the night- and dayside correspondingly. Poleward boundary of the AOP region is the b5e boundary on the nightside and the highest latitude boundary of the BPS type precipitation on the dayside. In the daytime sector the auroral oval locates in the equatorial part of the AOP. Poleward part of AOP contains here the mixed precipitation of BPS and LLBL types.
The belt of the high-latitude soft precipitation, SDP, adjoins the poleward boundary of the AOP region. The poleward boundary of SDP is the b6 boundary on the nightside and the poleward boundary of the LLBL type precipitation on the dayside
Poleward of SDP there is a polar cap on the nightside and cusp and/or the mantle type precipitation on the dayside. Auroral precipitation connected with the dayside polar cusp and plasma mantle are not included in the presented model.
On the magnetic activity level the statistical body of data was in the intervals:
AL - from 0 to -1500 nT
Dst - from +10 to -200 nT
Therefore it is recommended to use the model in these intervals of activity. However, we applied the derived equations of regression to study the behavior of precipitation during the periods of magnetic storms of much greater intensity (up to -600 nT in the Dst index) and have received a good agreement between calculated and experimental values.
Corrected geomagnetic co-ordinates were calculated by using AACGM (Altitude Adjusted Corrected Geomagnetic Coordinates) model [Baker and Wing, 1989].
Model: http://ccmc.gsfc.nasa.gov/requests/instant/instant.php?model=AACGM
Program: http://svn.phys.ucalgary.ca:8080/websvn/
To find the station (point) your interest on the planetary picture, please click "Add point" on our web model.
If you are going to use AP-Model any publications, please, make references to papers: